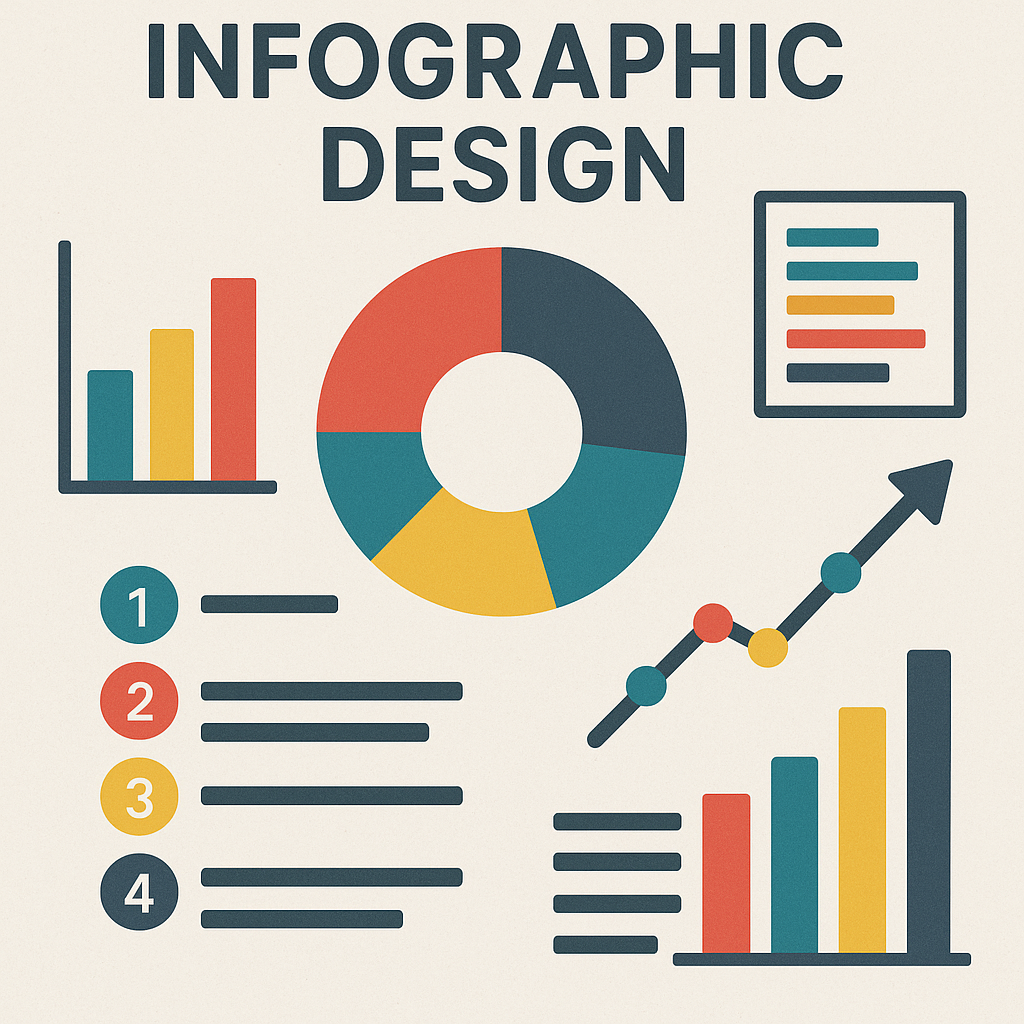
I will provide Infographic Designer for turning data Into visual stories
-
0 sales
- 5 views
- Save
0 /5.0
User review- Fast Turnaround
- Custom Designs
- Affordable Rates
- 100% Editable Files
- Revisions Included
Why Choose Me
- Expertise in Data Visualization
- Focus on Your Brand Identity
- Understanding of the Target Audience
- Creative Solutions for Every Project
- SEO and Social Media-Friendly Design
Fequently asked questions
What type of infographics do you design?
I create Statistical infographics (presenting data and statistics), Process infographics (showing steps or instructions), Comparison infographics (comparing different ideas, products, or services), Timeline infographics (showing historical events or future projections), Geographical infographics (using maps and location data), List-based infographics (for tips, checklists, or key points).
Can you help me create interactive infographics?
Yes, I can design interactive infographics that engage your audience. These are often used for websites or presentations and may include features like hover effects, clickable sections, or animated elements.
Will I get ownership of the infographics you create?
Yes, once the project is completed and the payment is received, you will have full ownership of the infographics. You can use, modify, and distribute them as you see fit.
Can you create infographics for specific industries (e.g., healthcare, finance, etc.)?
Yes, I have experience designing infographics for various industries, including healthcare, finance, technology, marketing, and education. I tailor each design to suit the specific industry’s needs, ensuring that it aligns with the target audience and communicates the intended message effectively.


